algorithmic Me
COVID-19: Data visualization
In the COVID-19 repository I share a set of little software tools written in Python3 to visualize the evolution of the COVID-19 outbreak around the world. They are designed to show data from the next databases:
- 2019 Novel Coronavirus COVID-19 (2019-nCoV) Data Repository by Johns Hopkins CSSE.
- National reports by Ministerio de Salud de la Nación Argentina.
- Datasets in datos.gob.ar.
the data
I loaded the data (until October 1st 2020) from the National reports by Ministerio de
Salud de la Nación Argentina manually in a spreadsheet exported to a *csv* file afterwards. Note that this
file has a lot of holes because the reports are not complete (some data is not separated by province).
Confirmed cases and deaths series are complete, but active cases, laboratory tests and
dropped cases are not. If there is a difference between the total and the sum of all districts I add it
in UNKNOWN field.
To visualize data from 2019 Novel Coronavirus COVID-19
(2019-nCoV) Data Repository by Johns Hopkins CSSE or from the
Datasets in datos.gob.ar you need to download that files
first. Data on Argentina.csv is processed and save to a set of csv files with disctint
information. For example: daily confirmed cases, daily deaths or dialy confirmed cases
trend (taking averages for 3 or 5 days).
the charts
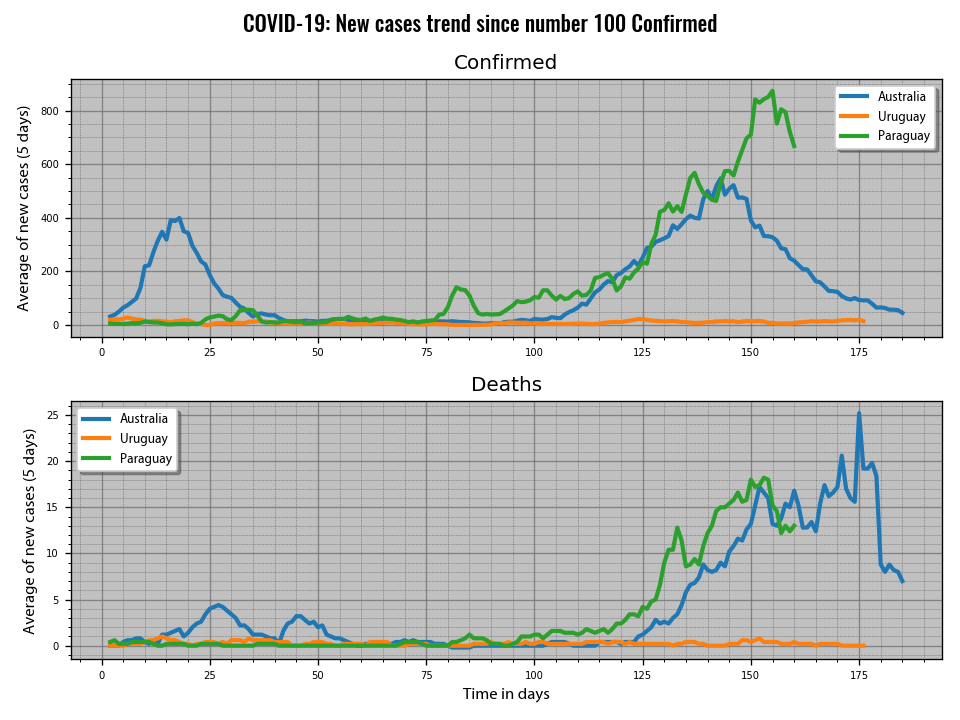
You can obtain different charts to visualize the data. You can plot the data by date or aligning it when a certain condition is fulfilled (selected number of confirmed cases or deahts). You can control which charts to show/save with a set of booblean varialbles you will find in the code. I save some of them in Argentina_Data/actual_charts.
the definitions
The csv files and the charts made to show the data for the outbreak evolution in Argentina contains certain categories. Understand each one clearly is important to get the facts right. Take into account these definitions:
- Confirmed case: represents an infected person who was detected by the authorities.
- Confirmed cases: total number of confirmed cases.
- Active cases: confirmed cases minus recovered cases.
- Deaths: number of confirmed cases ended with patient's death.
- New daily cases: the number of new cases or deaths registered each day. They are obtain subtracting total cases from two consecutive days (cn+1 - cn). New cases trends are saved, taking averages for 3 and 7 days.
- Death rate: proportion of confirmed cases which ends in patient's death (deaths / confirmed cases).
- Linear duplication time: the number of days needed to cumulative cases to double ir new daily cases remain constant. Duplication time trends are save, taking averages for 3 and 7 days.
- Positive ratio: the proportion or laboratory test with a positive result (positives / laboratory tests). Is calculated taking daily tests 3 days average and total cumulative tests.
- Estimation of real cases: an estimation of real infected population from total deaths, taking a certain real mortality ratio and the average time between symptoms onset and death.
- Known cases ratio: the proportion of real cases which were confirmed (confirmed cases / estimation).